Deadzone test and curve visualizer
 InputConfig is completely free on the Mac App Store.
Drag the stick below, or connect a controller and press any button on it to use its real left stick. The plot shows the raw position, the inner deadzone where nothing happens, the outer deadzone where the output reaches full, and the curve between them. If you record a few seconds with the stick at rest, it suggests an inner deadzone that hides the drift. To measure drift on both sticks as a number, use the stick drift test.
Source: virtual stick (drag the dot, or focus the plot and use the arrow keys; Home recenters). Press a button on a connected controller to switch to it.
The curve shows output against stick travel after the deadzones are removed. Smooth keeps the first part of the travel gentle, which suits pointing and shaky hands; Aggressive reaches full speed early, for turning in games. With Variable sensitivity off, anything past the inner deadzone is full output.
Putting the numbers in InputConfig
- Open the preset in the editor and expand Options on a stick row (or use Stick settings in the device's menu to set every axis at once).
- Set Deadzone, the inner deadzone, to the suggested value, or a little above the drift you saw here.
- Set Full push at, the outer deadzone, to where the stick comfortably stops. Anything past it counts as full.
- Pick the curve and switch Variable Sensitivity on for pointer and scroll rows.
- Press Adjust live on the row to confirm with the app's own live plot.
The curves here are illustrative shapes; the app's own plot is the reference. Everything stays in your browser, and the page can only read the controller while this tab is open.
Reading the plot
The white dot is where the stick really is. The shaded red circle is the inner deadzone: while the dot is inside it, the output is zero. The dashed ring is the outer deadzone: past it, the output is full. The blue line from the center is what comes out after both deadzones and the curve. Recorded rest positions show as small yellow dots. In the readout, raw is the distance from center, from 0 to 1, and output is the percentage that would be sent.
A healthy stick at rest sits on or very near the center. A drifting one rests off to one side, or wanders. Record 3 seconds at rest takes the furthest point it reached, adds a small margin and sets the inner deadzone for you.
Inner and outer deadzone, in plain words
The inner deadzone is how far the stick has to move before anything happens. It hides drift and a shaky hand, and every point you add is travel you lose, so use the smallest that works. The outer deadzone is where the stick counts as pushed all the way, which helps a worn stick that no longer reaches its edge, or a hand with a short reach. Between them the travel is stretched to cover the full range, so nothing jumps at the edge of the deadzone.
An anti-deadzone is the opposite trick: it adds a little to every tilt so it clears a game's own deadzone. It matters for tools that pretend to be a controller. InputConfig sends keys and mouse movement instead, so it has none and needs none. What a controller deadzone is goes through each kind.
Drift on a Mac: what to do with the number
Where you put the number depends on who reads the controller. A game with its own controller support needs it in the game's settings or in Steam Input. For anything InputConfig drives, the pointer, scrolling or keys, it goes on the stick row in the app. Stick drift on a Mac walks through each case, calibrating a controller on a Mac covers what macOS does and does not offer, and the deadzones help page shows where each setting is in the app. This page reads the left stick only; for the right stick or a trigger, use Adjust live in the app.
How this fits with InputConfig
This page checks that a controller works. InputConfig is what puts it to work on a Mac: it maps every button, stick and trigger to keys, clicks, the pointer or scrolling, per app if you like, and its Live Visualizer draws the controller live with what each control does.
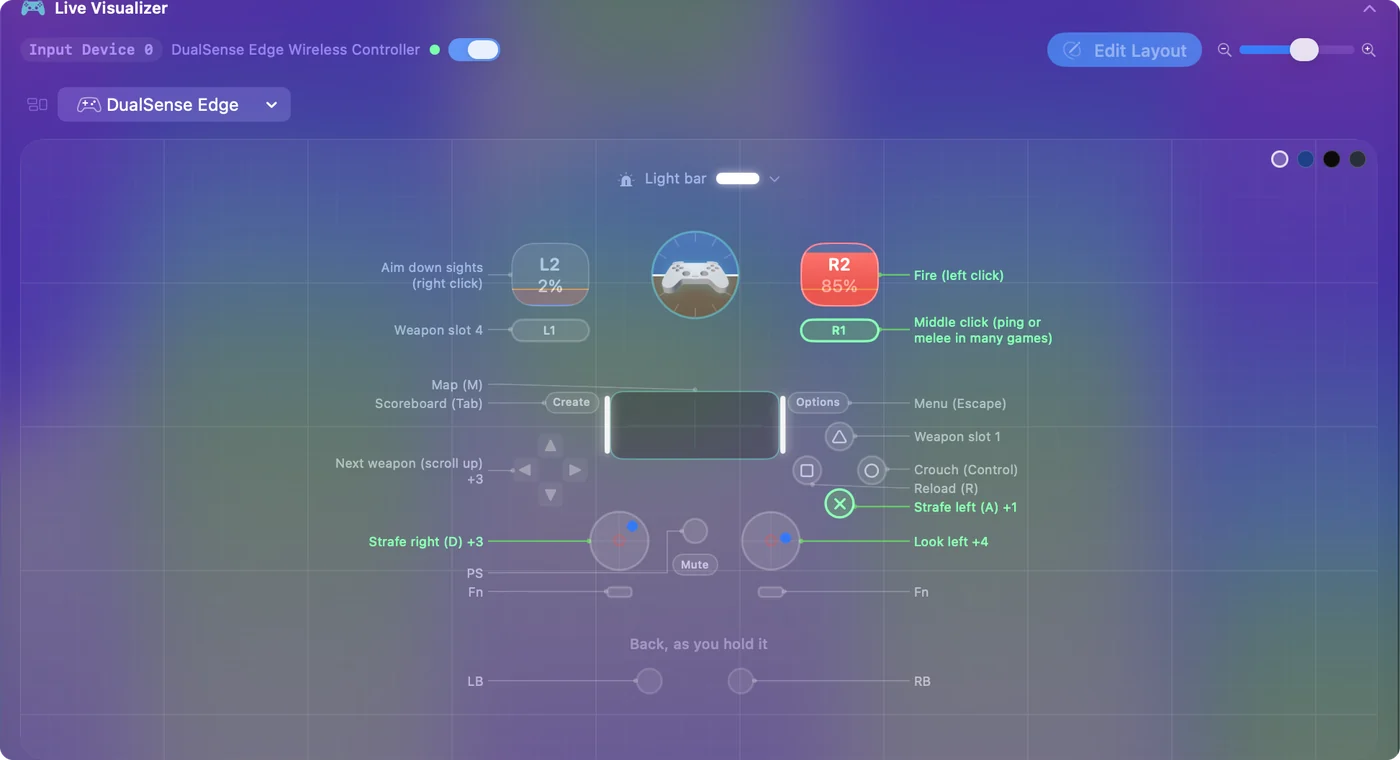
Use a controller as a mouse on a Mac shows it step by step. InputConfig is free on the Mac App Store.
More controller tests
- Gamepad tester
- Stick drift test
- PS5 controller drift test
- Xbox controller drift test
- Joy-Con drift test
- Controller vibration test
- Controller button test
- Controller trigger test
- Controller polling rate test
- Joystick test
- Racing wheel tester
- Arcade stick tester
- PS5 controller tester
- PS4 controller tester
- Xbox controller tester
- Switch Pro Controller tester
- Joy-Con tester
- 8BitDo controller tester
- Gamepad viewer and controller overlay
- Controller button names and map
- Controller ID lookup
- Controller fix finder
- Mac game controller finder
- Preset chooser
Questions
How do I test a joystick's dead zone?
Connect the controller and press a button so the page reads its left stick, or move the virtual stick on the page. The plot shows where the stick is, the inner deadzone where nothing happens, and how much output is left once it is past.
What deadzone hides stick drift?
Record three seconds with the stick at rest. The page takes the largest drift it saw and suggests an inner deadzone a little above it, which is the smallest setting that hides the drift.
What is the difference between an inner and an outer deadzone?
The inner deadzone is the area around the center where movement is ignored, which hides drift. The outer deadzone is the point where the stick counts as fully pushed, which helps a stick that never quite reaches its edge.
Completely free. You don't have to make an account, there are no subscriptions, and nothing is locked. Optimized for Apple silicon. Open source on GitHub.
Updated